The PLANTLOGIQ PLATFORM builds a highly detailed model of your plant, based on real condition data. Maintenance scenarios, weak-point analyses and long-range forecasts can all be played through digitally. The result: better decisions, shorter downtime and more efficient use of crews and resources.
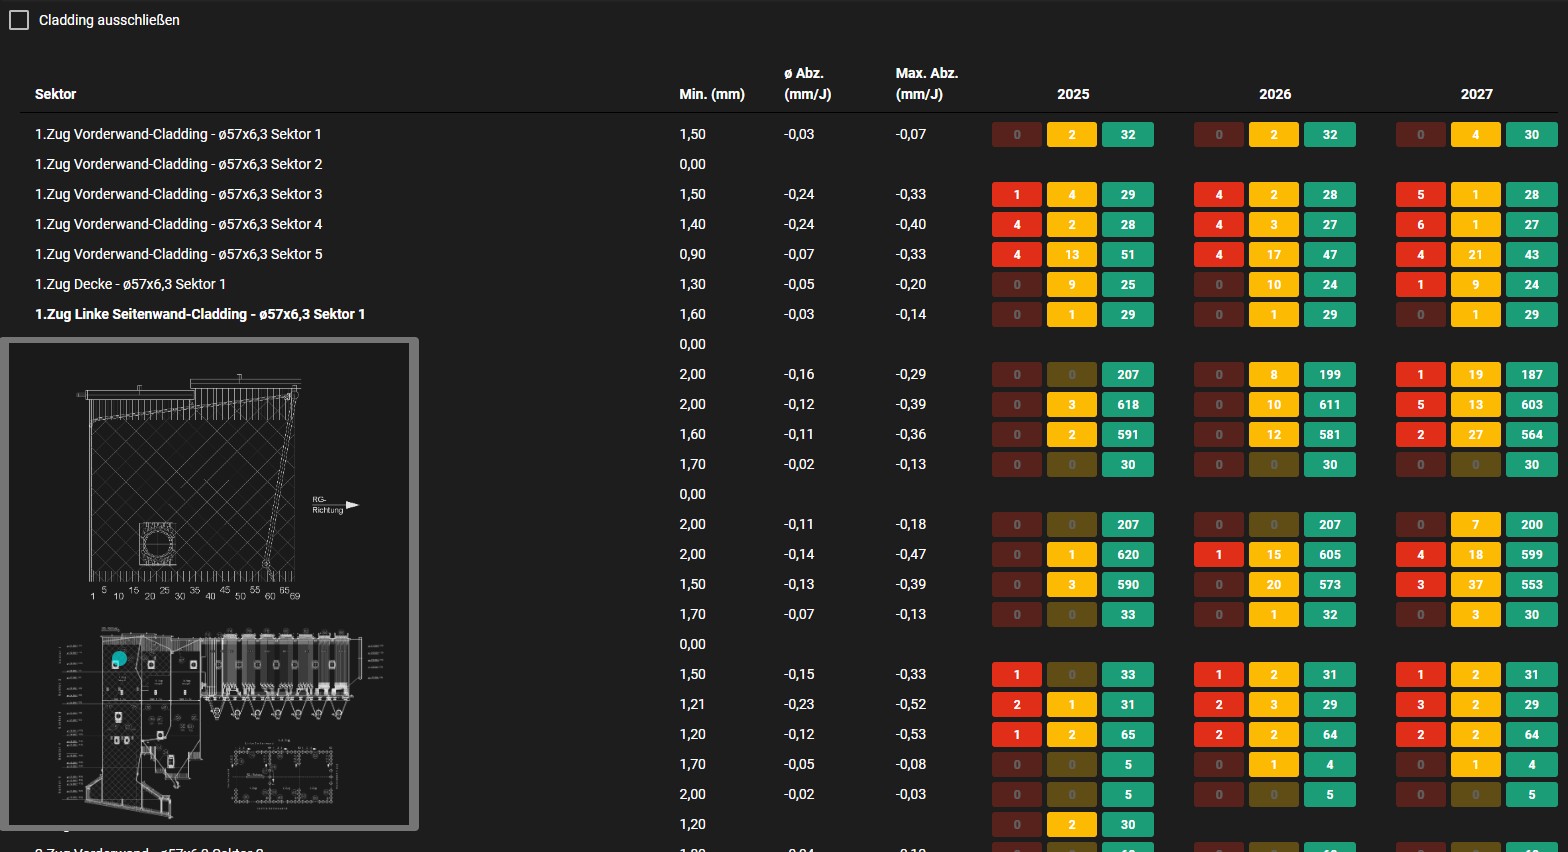
The PLANTLOGIQ PLATFORM turns your plant data into a digital blueprint, colour-coded on a traffic-light scale. One glance shows you where the critical spots are and which areas need watching – and, just as usefully, where everything is in the green. No more hunting through spreadsheets, no more loose documentation: everything is linked, clearly laid out and available at any time.
The PLANTLOGIQ PLATFORM doesn’t just show you the current condition of your plant – it shows you where action will be needed in future.
The software analyses historical and current readings, calculates the wastage rate and predicts precisely when an area will become critical. You plan your outages where they count and avoid unplanned shutdowns.
The result: more efficiency, lower costs – and the confidence of acting in the right place at the right time.
Wall thicknesses, refractory condition, grate bars, photos, outage reports, forecasts – every piece of information comes together in the PLANTLOGIQ PLATFORM. You keep track of your plant’s condition, make well-founded decisions and build the ideal basis for predictive maintenance – without losing a thing along the way.
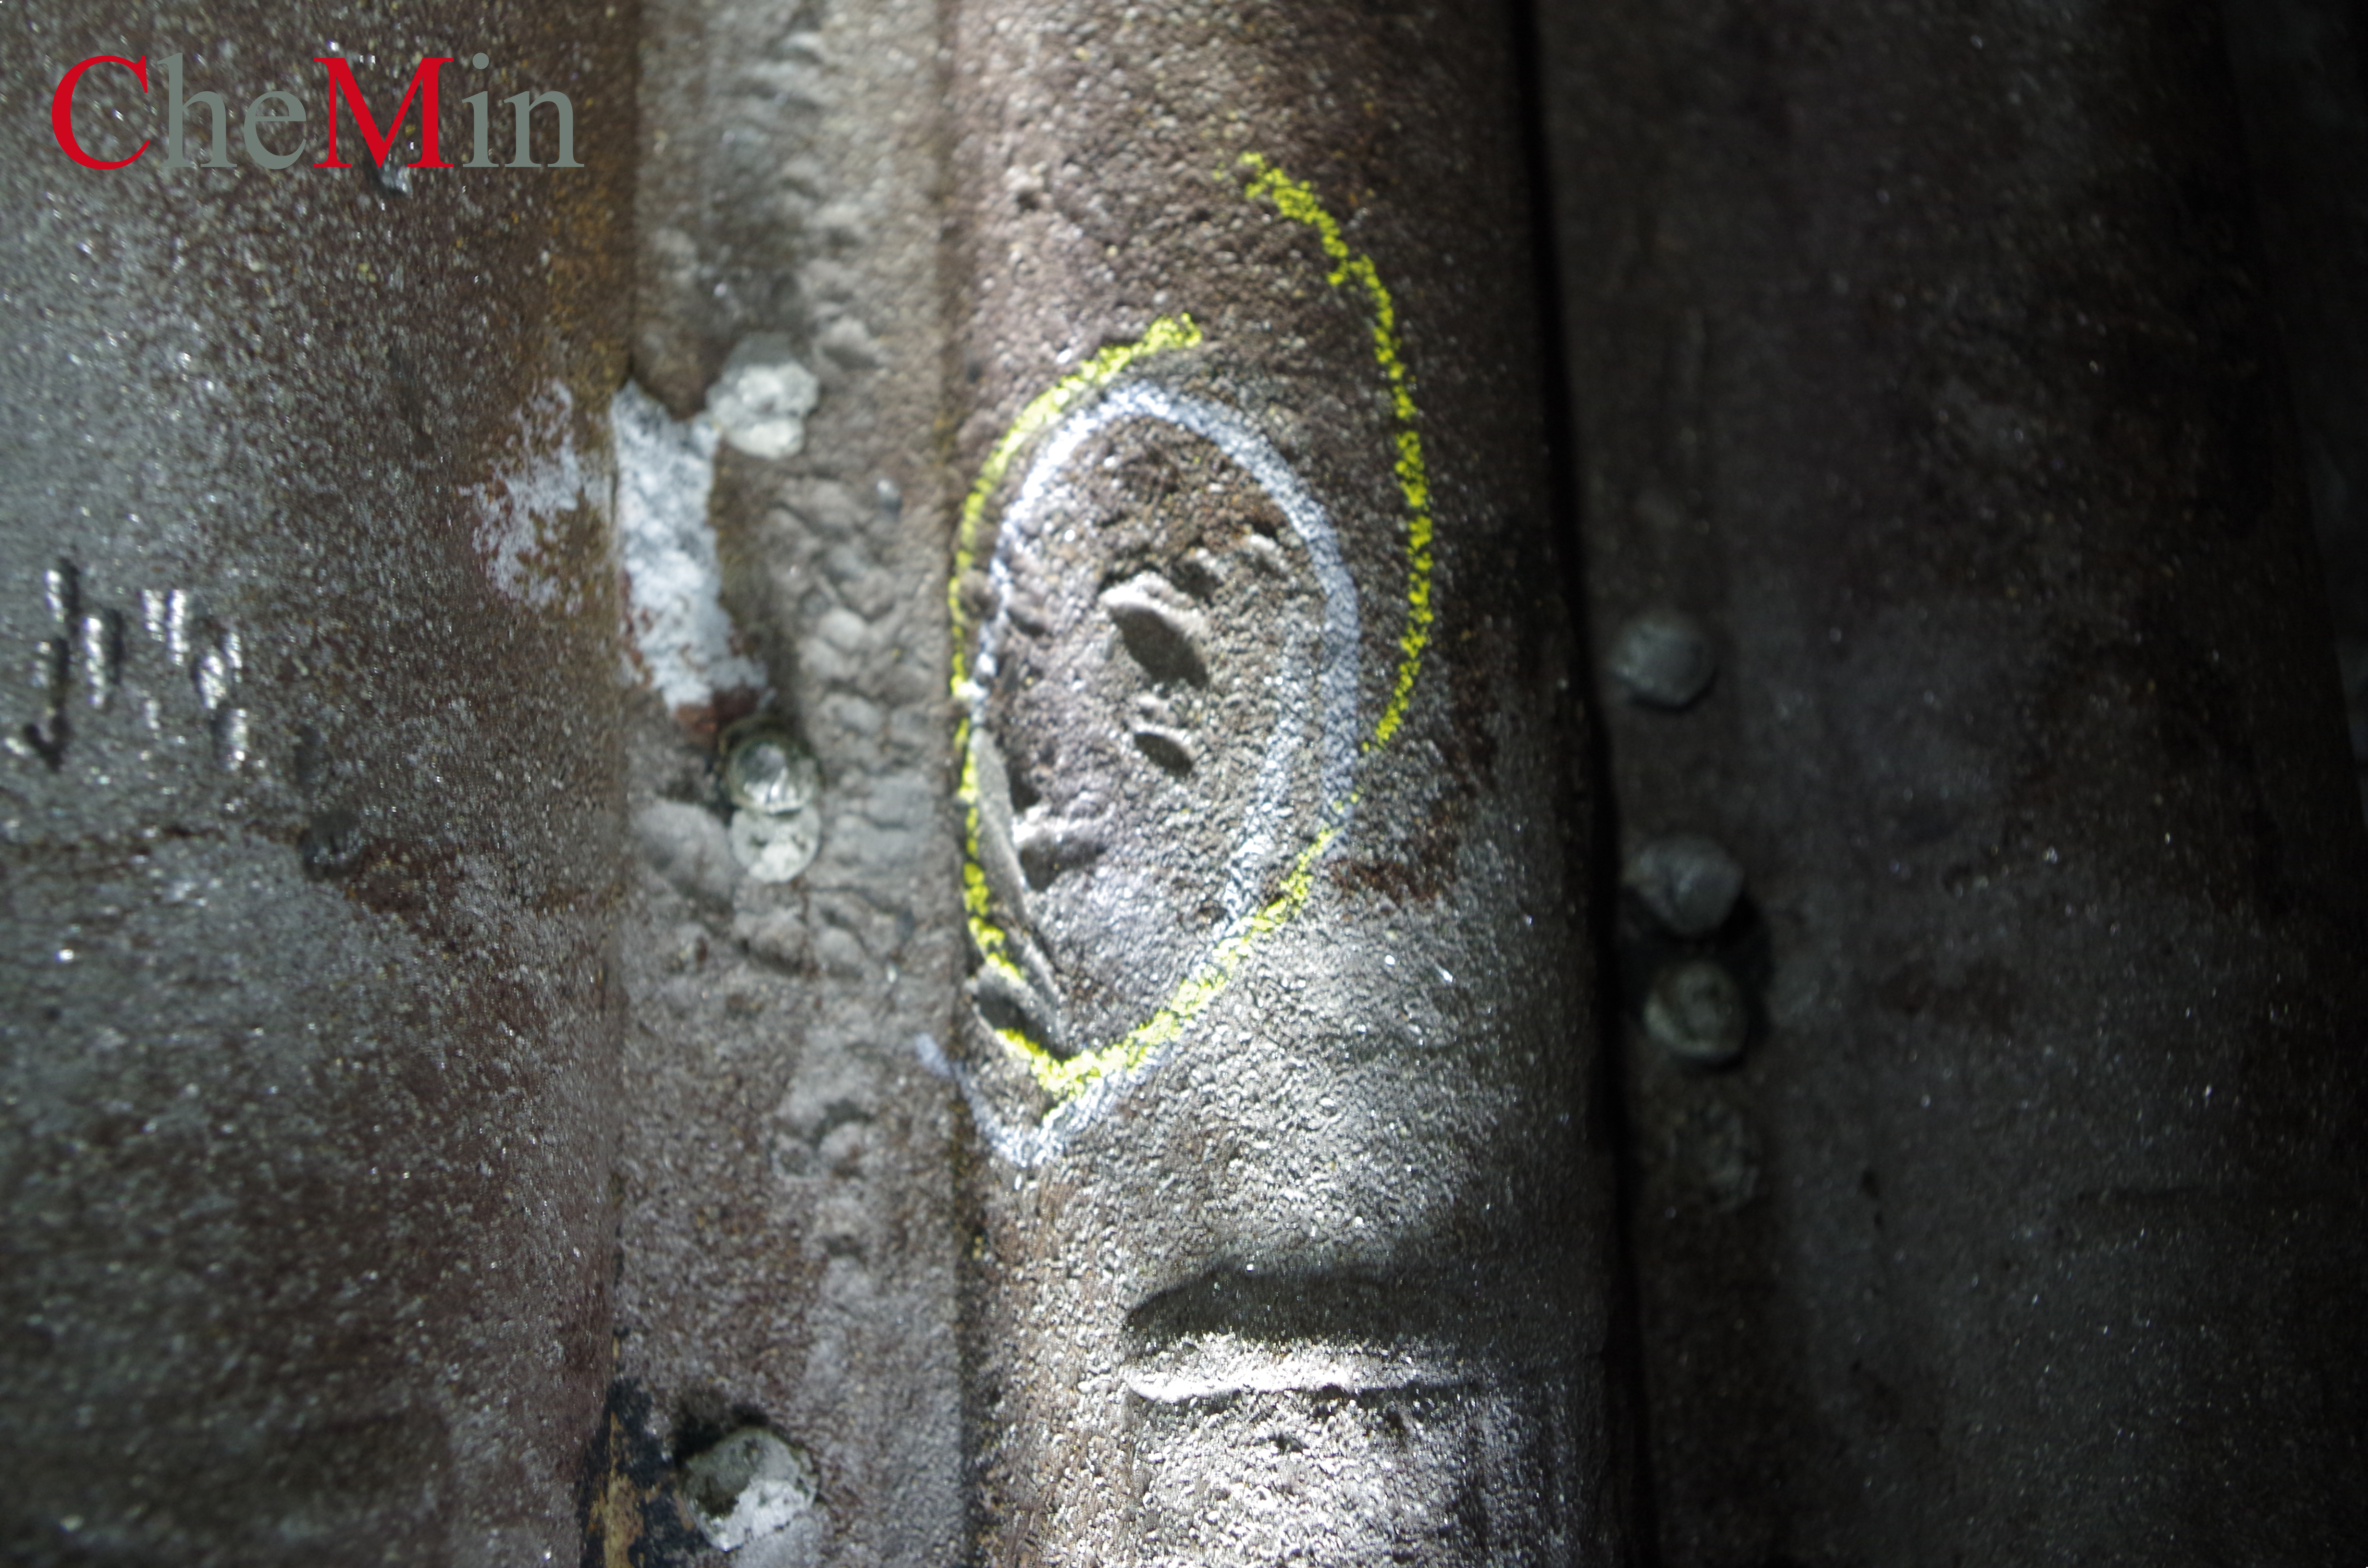
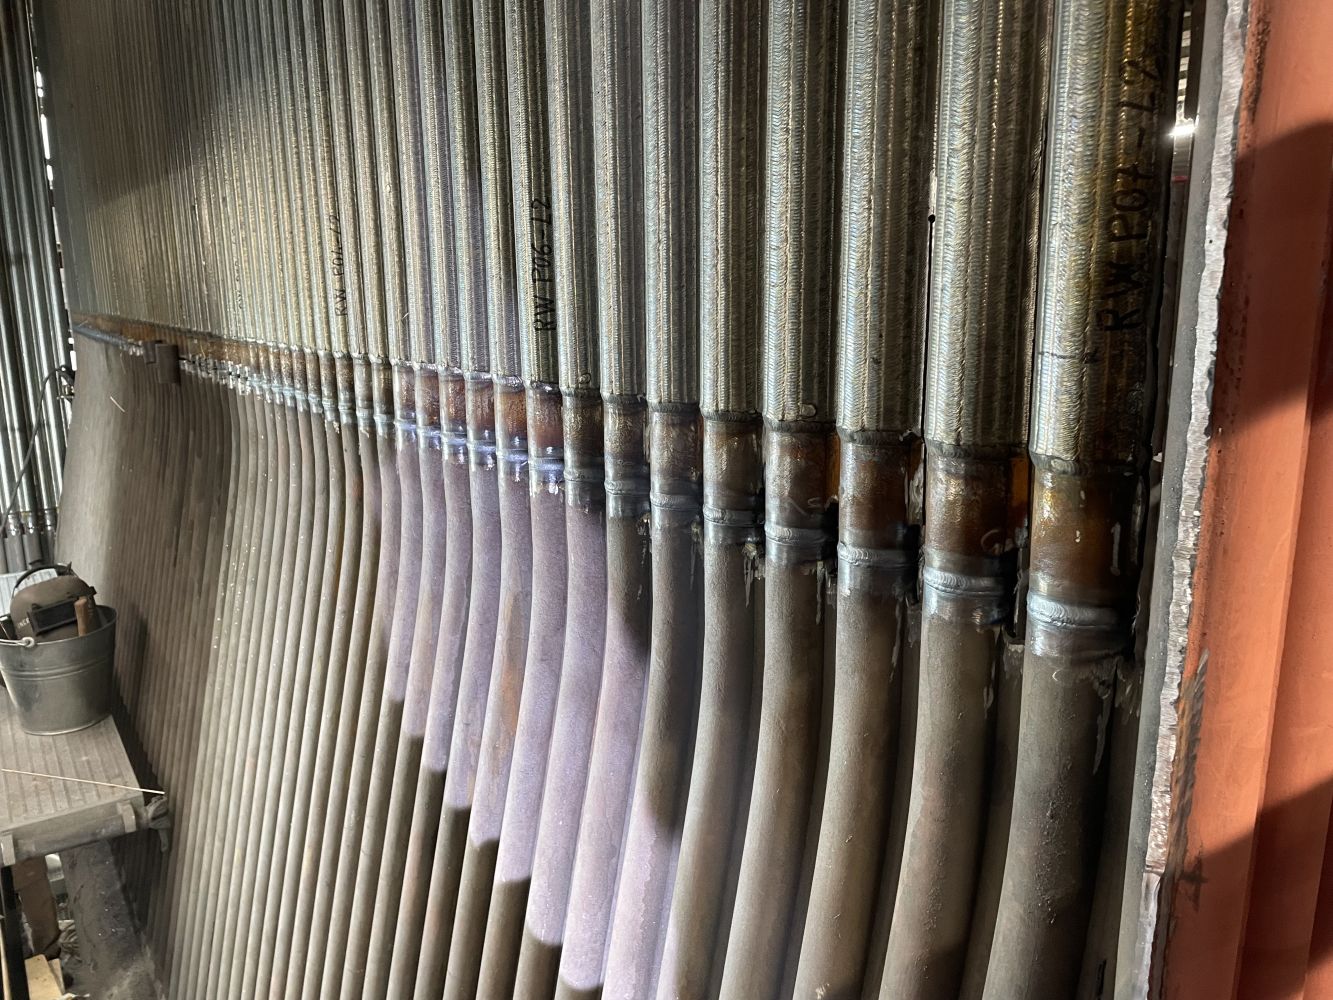
Targeted action, exactly where it’s needed: specialists take on the critical areas. Repairs and protective measures are documented as they happen – with photos, reports and technical drawings. Everything lands in the right place in the PLANTLOGIQ PLATFORM.
Every piece of information. One system. Full control. After the outage, all data is checked, completed and stored centrally. That keeps everything in view – including forecasts, threshold checks and traffic-light status for the decisions ahead.
3 reasons. 1 system.
Everything in view
Every reading, planned outage and measure in one place – available at any time.
Decide faster
Plan from data, minimise downtime, put budget and resources exactly where they count.
Keep the knowledge
Historical data and expert know-how stay with the plant – whoever is on shift, however many years pass.